The Resurrection of Two-Year Highs
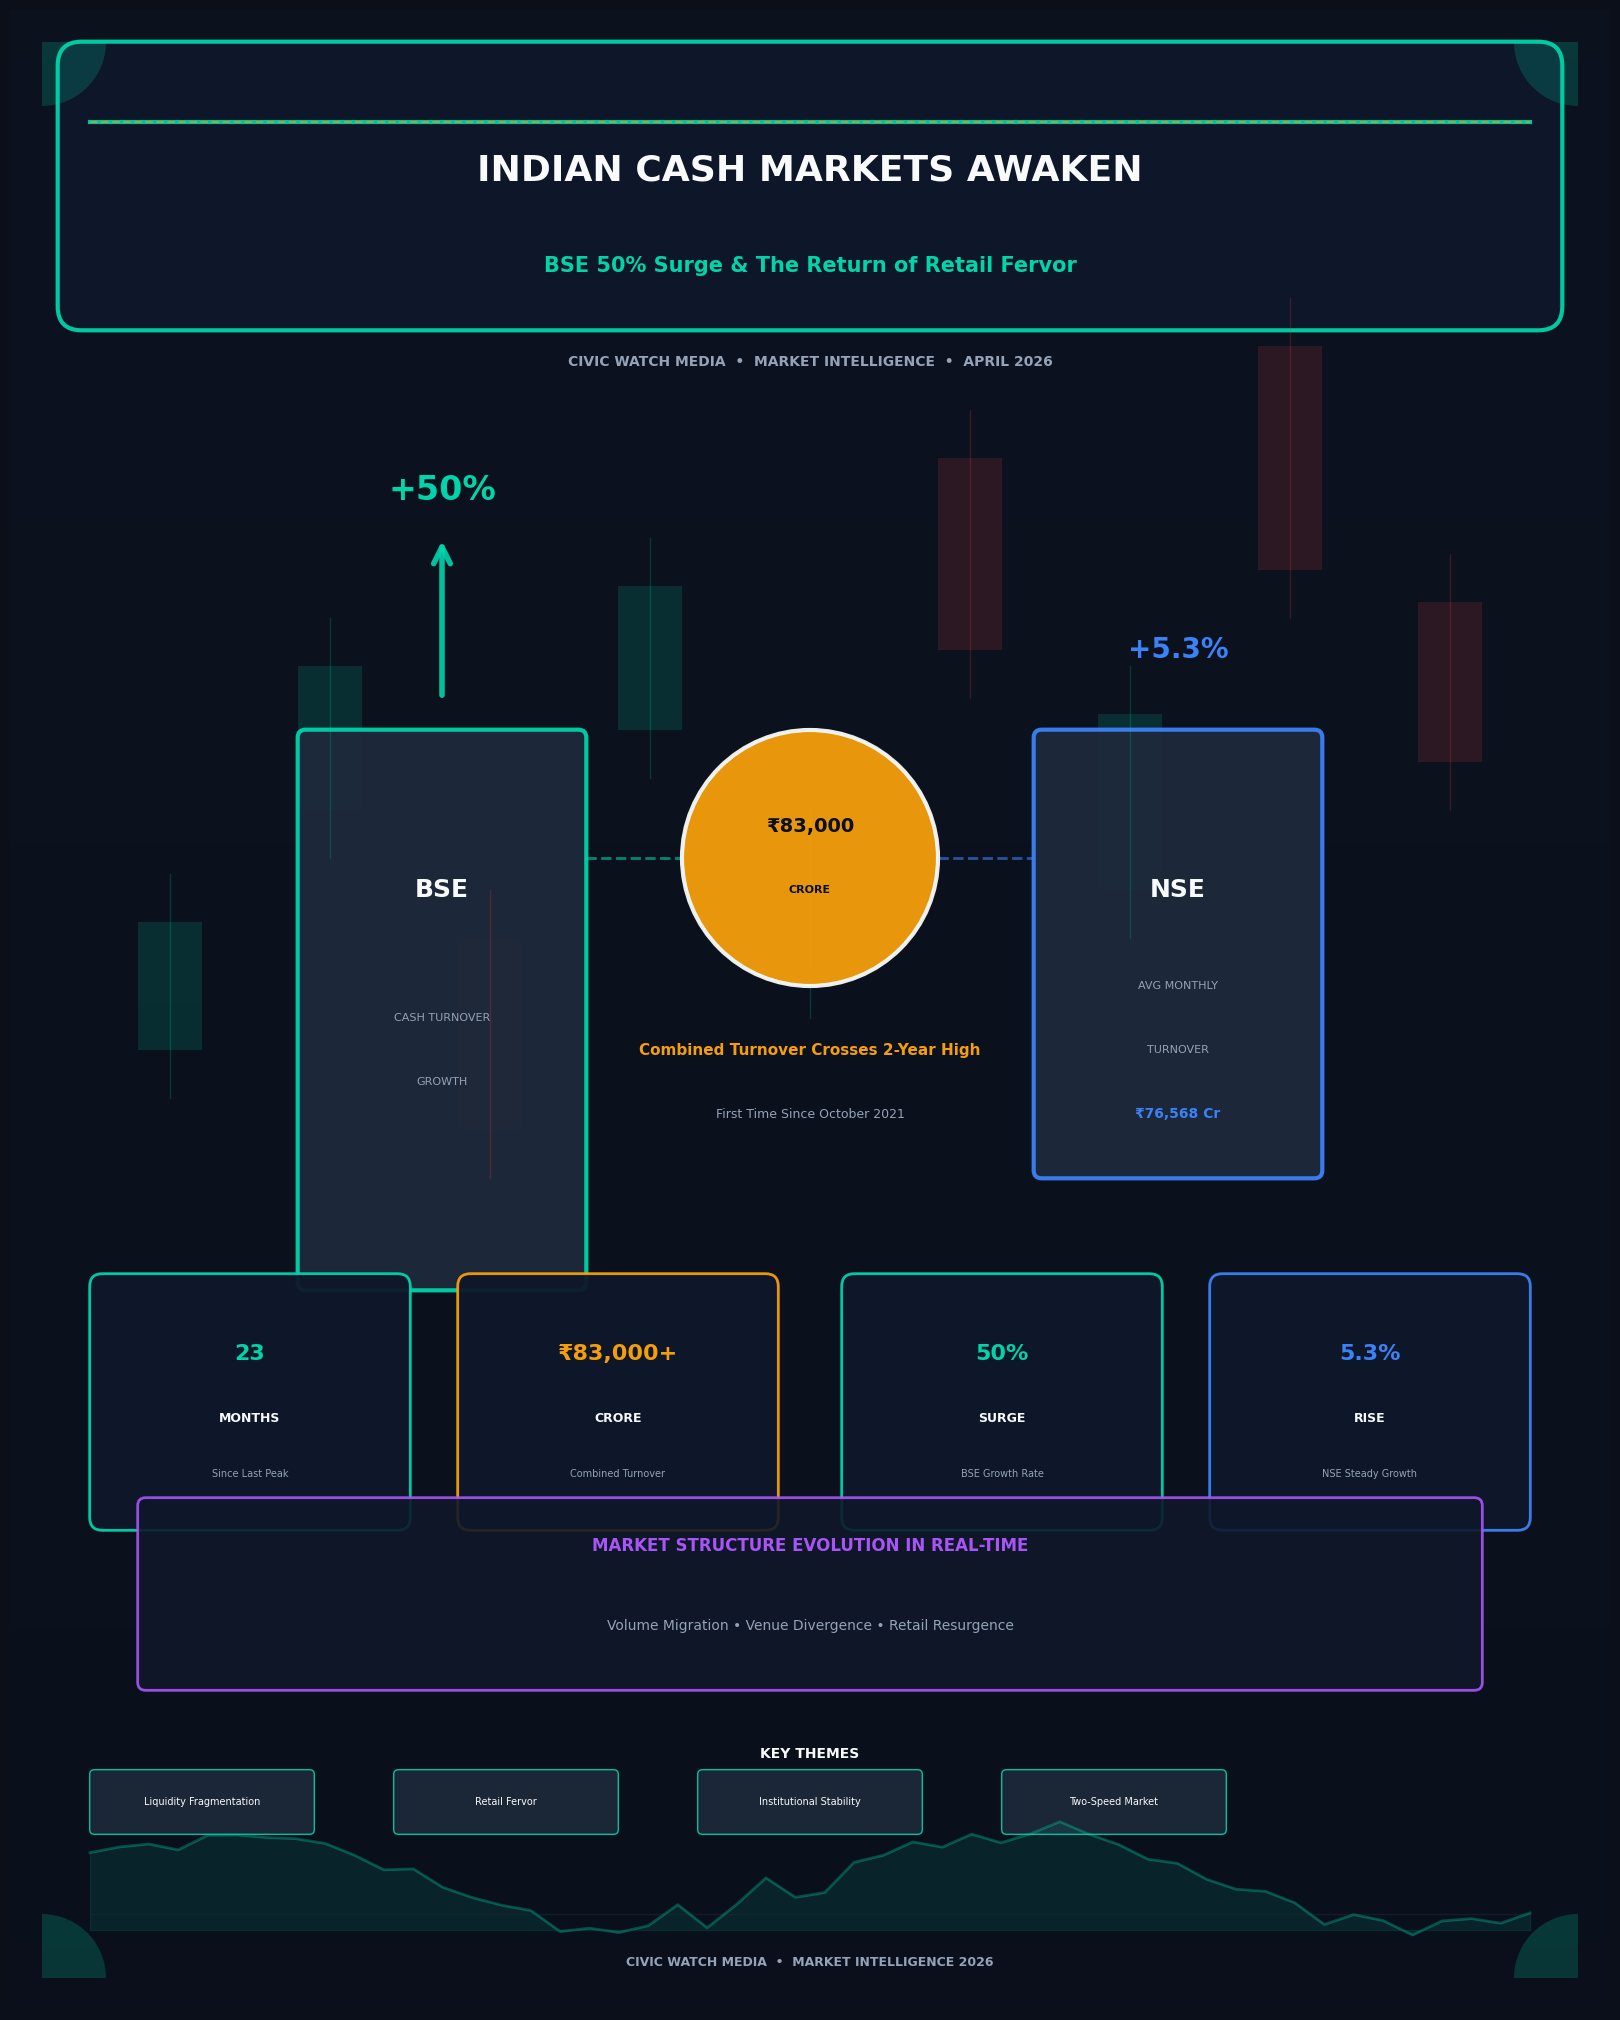
India's equity cash markets have delivered a statistical jolt that demands attention from institutional desks and retail participants alike. August 2023 marked the first time since October 2021 that combined exchange turnover crossed the ₹83,000 crore threshold—a 23-month hiatus that signals more than routine volatility. This isn't merely a number breaching a psychological barrier; it's validation that liquidity flows, dormant through multiple correction cycles, are reactivating with conviction.
The divergence between exchange performances tells a more nuanced story than aggregate data suggests. While the National Stock Exchange (NSE)—India's dominant venue by institutional preference—recorded a measured 5.3% month-on-month expansion to ₹76,568 crore average monthly turnover, the Bombay Stock Exchange (BSE) executed a near-parabolic 50% growth trajectory in August cash turnover.
This disparity isn't noise. It's evidence of shifting participant behavior, platform-specific dynamics, and potentially, the early stages of a broader market structure evolution that has implications for execution quality, price discovery, and regulatory oversight.
Decoding the Numbers: What ₹83,000 Crore Represents
Historical Context
The October 2021 reference point carries significance. That period represented the post-pandemic retail trading boom peak, when work-from-home demographics, stimulus-inflated savings, and meme-stock culture converged to create unprecedented domestic participation. The subsequent 23-month contraction reflected:
→ Normalized economic activity reducing screen time and speculative capital deployment
→ Interest rate tightening redirecting liquidity toward fixed income alternatives
→ Global risk-off sentiment triggered by Federal Reserve policy and geopolitical instability
→ Domestic valuation concerns as mid and small-cap indices reached stretched multiples
The August 2023 recovery, therefore, isn't continuation of an established trend—it's reversal formation requiring distinct analytical treatment.
The BSE Phenomenon: Fifty Percent in Thirty Days
A 50% monthly expansion in cash turnover defies organic growth patterns. This magnitude suggests:
1. Base Effect Amplification
BSE's cash market share had compressed to historically low levels relative to NSE. From a diminished baseline, proportional growth appears exaggerated even when absolute additions remain modest. However, the velocity of change indicates active participant migration rather than statistical artifact.
2. Segment-Specific Dynamics
BSE's historical strength in small-cap and micro-cap listings—segments where NSE's institutional dominance is less pronounced—may explain differential growth. If August saw retail rotation toward riskier market capitalizations, BSE's transaction volume would disproportionately benefit.
3. Technological and Cost Considerations
Exchange fee structures, co-location latency advantages, and API accessibility evolve continuously. BSE may have captured algorithmic and high-frequency flow through competitive positioning on execution economics.
4. The Relisting and Migration Narrative
Corporate actions, including inter-exchange migrations and new listings, can create temporary volume spikes. August's data requires verification against listing activity calendars.
NSE's Steady State: Institutional Anchoring
The 5.3% NSE expansion to ₹76,568 crore represents sustainable, institutionally-driven growth. This venue's dominance in:
→ Futures and options convergence trades requiring cash market hedging
→ Index constituent rebalancing flows from passive and active mandates
→ Foreign portfolio investor execution through qualified broker channels
→ Block and bulk deal infrastructure for institutional size transactions
...creates volume baselines less susceptible to retail sentiment oscillations. The measured growth suggests institutional participation stability even as retail dynamics explode on competing venues.
Structural Implications: A Two-Speed Market
For Market Participants
Liquidity Fragmentation Risk: Divergent growth rates between exchanges may create execution quality dispersion. Orders routed to BSE for cost advantages may encounter wider spreads or depth limitations during stress periods.
Arbitrage Opportunities: Price discovery discrepancies between venues—historically minimal due to co-location and algorithmic linkage—may widen if volume imbalances persist, creating statistical arbitrage potential.
Data Integrity Considerations: Regulatory surveillance and market abuse detection systems must adapt to volume concentration shifts. BSE's surveillance infrastructure adequacy for 50% volume surges warrants verification.
For Regulatory Architecture
The Securities and Exchange Board of India (SEBI) faces renewed questions about exchange competition policy:
→ Transaction fee regulation and whether asymmetric pricing creates market structure distortions
→ Consolidated tape implementation to ensure transparent price discovery across fragmented venues
→ Circuit breaker harmonization given differential liquidity profiles during stress events
→ Cross-exchange risk management as clearing corporation concentration creates systemic exposure
For Investment Strategy
The turnover recovery carries predictive implications:
Volume-Price Validation: Sustained turnover expansion above ₹80,000 crore monthly historically correlates with index momentum persistence. August's data, if maintained through September, supports bullish structural positioning.
Retail Sentiment Gauging: BSE's disproportionate growth suggests retail—rather than institutional—participation acceleration. This demographic's procyclical behavior (chasing momentum, panic selling corrections) implies volatility regime persistence.
Sector Rotation Signaling: Cash market turnover expansion concentrated in specific market capitalizations (small/mid-caps on BSE versus large-caps on NSE) provides real-time rotation intelligence.
The October 2021 Parallel: Cautionary Context
The last ₹83,000 crore monthly print preceded a 22% Nifty50 correction over subsequent six months. Historical coincidence doesn't imply causation, but the comparison warrants consideration.
October 2021 Environment:
- Nifty50 Valuation: 24x forward P/E
- Retail DMAT Accounts: 70 million
- FII Flows: Record outflows
- Interest Rate Regime: Accommodative
- Global Risk Appetite: Elevated
August 2023 Environment:
- Nifty50 Valuation: 20x forward P/E
- Retail DMAT Accounts: 110 million
- FII Flows: Moderate inflows
- Interest Rate Regime: Restrictive
- Global Risk Appetite: Normalized
The August 2023 environment exhibits superior fundamental grounding—lower valuations, expanded retail base, and realistic rate expectations—suggesting sustainability absent in the 2021 comparison.
Forward Trajectory: Sustaining the Momentum
For the ₹83,000 crore threshold to represent
For the ₹83,000 crore threshold to represent trend rather than anomaly, several conditions must converge:
Domestic Flow Persistence: Systematic Investment Plan (SIP) inflows must maintain ₹15,000+ crore monthly run-rates, providing baseline retail support.
Institutional Reactivation: Foreign portfolio investor participation—absent in August's BSE surge—must complement domestic liquidity for broad-based index advancement.
Primary Market Support: Initial Public Offering (IPO) pipeline revival absorbs trading capital but validates market depth for sustained turnover expansion.
Volatility Regime Management: The VIX index behavior during turnover expansion phases indicates whether volume reflects directional conviction or hedging anxiety.
Conclusion: The Liquidity Inflection
India's exchange turnover data for August 2023 communicates a market structure in transition. The BSE's 50% surge—whether sustainable competitive resurgence or temporary retail rotation—challenges assumptions about NSE's unassailable dominance. The ₹83,000 crore combined threshold breach validates liquidity recovery narratives that have supported bullish positioning through 2023's consolidation phases.
For sophisticated market participants, the message transcends headline numbers. Volume is migrating, venues are diverging, and the institutional-retail execution landscape is evolving. Strategies calibrated to NSE-centric liquidity assumptions require recalibration. Risk management frameworks must incorporate multi-exchange dynamics.
The October 2021 ghost—visible in the ₹83,000 crore reference—serves as discipline rather than prophecy. Markets with expanded retail bases, moderated valuations, and policy-supported domestic flows possess structural advantages absent two years prior.
The turnover surge isn't merely recovery. It's market structure evolution in real-time, with implications for execution, regulation, and strategy that will define India's equity landscape through 2024 and beyond.
Civic Watch Media Market Intelligence will continue monitoring exchange turnover dynamics and cross-venue liquidity evolution.
Published: April 2, 2026 | Data analysis based on BSE and NSE official turnover statistics for August 2023